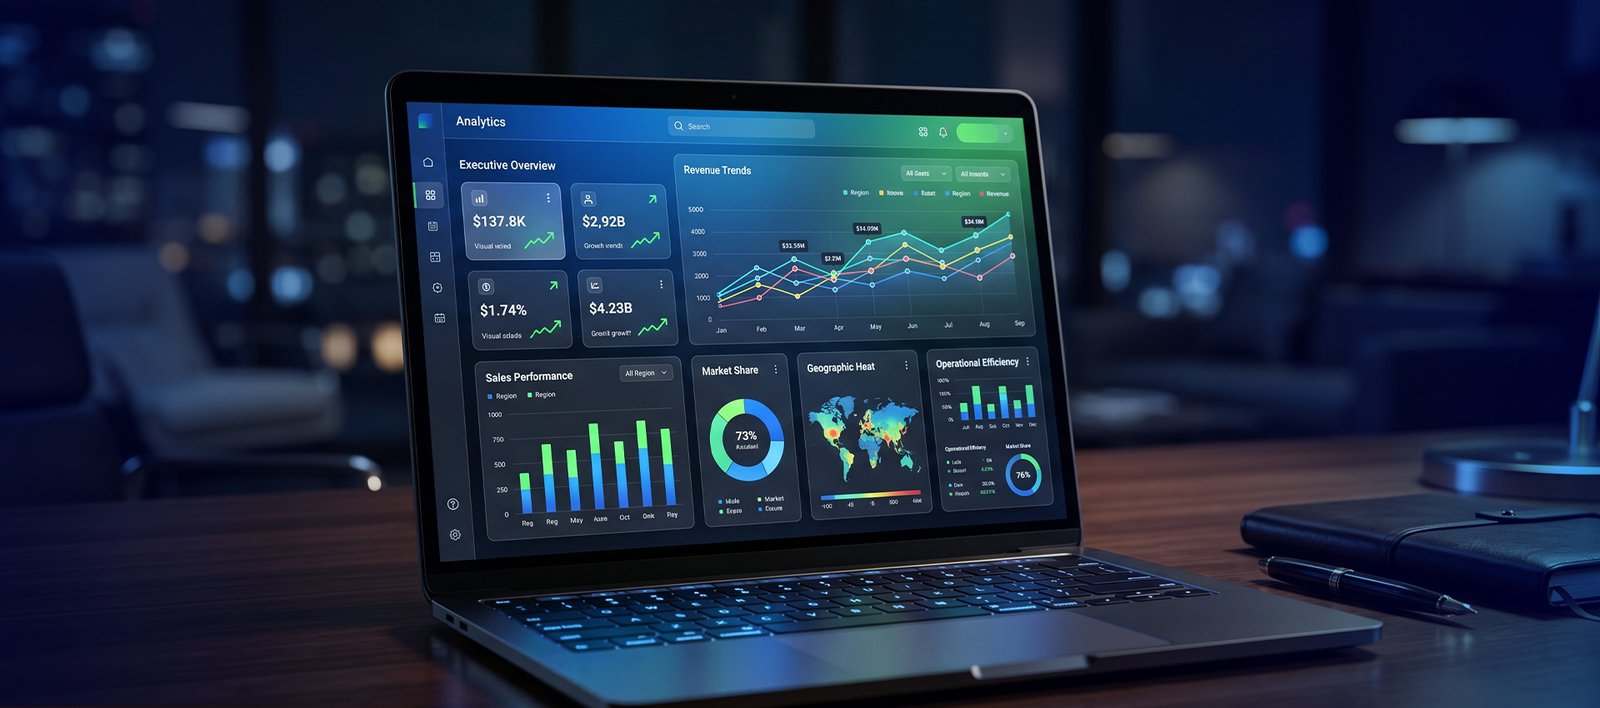
Most businesses already have data across spreadsheets, ERP systems, CRMs, marketing platforms, and operational applications. The real challenge is not collecting data—it is transforming that information into accurate, reliable insights that leaders can confidently use for decision-making.
ZS Global delivers Data Analytics and Business Intelligence solutions using platforms such as Power BI and Tableau to centralize reporting, standardize business metrics, and create interactive dashboards. Our solutions provide visibility across your organization, helping you improve operational performance, optimize costs, and identify growth opportunities through trusted, data-driven insights.
We design scalable Business Intelligence environments that connect multiple data sources, establish governance standards, and deliver role-based dashboards tailored to executives, managers, and operational teams.
We integrate data from multiple business systems into unified dashboards, eliminating fragmented reporting and providing a single, trusted source of truth for decision-makers.
Using Power BI and Tableau, we develop interactive dashboards that enable users to explore trends, analyze performance, and gain actionable insights through intuitive visualizations.
We establish consistent KPIs, reporting definitions, and business metrics so every department works with accurate, aligned, and comparable information.
Our reporting solutions support both near real-time analytics and scheduled reporting, ensuring stakeholders always have timely information for operational and strategic decision-making.
We implement data validation, transformation rules, governance policies, and quality controls to improve reporting accuracy and build trust in business data.
We create customized dashboards for sales, marketing, finance, operations, HR, and executive leadership, delivering relevant insights for every business function.
Our Business Intelligence platforms are designed to grow with your organization, supporting additional data sources, departments, users, and advanced analytics as business needs evolve.
Executive dashboards provide visibility into revenue, profitability, operational efficiency, customer trends, and strategic KPIs, enabling faster and more informed business decisions.
We identify key business questions, stakeholders, and decision-making needs to ensure reporting focuses on meaningful outcomes.
We map all relevant data sources including ERP, CRM, finance systems, marketing tools, and spreadsheets to design a unified data flow.
We design data models that structure raw data into meaningful relationships, metrics, and hierarchies for reporting.
We create intuitive dashboards in Power BI or Tableau that present insights clearly while allowing users to explore underlying details.
We review metrics with stakeholders to ensure dashboards reflect agreed definitions and business logic.
We publish dashboards, configure access controls, and train users so they can interpret insights confidently.
We automate data refresh processes to ensure reports remain current without manual effort.
We document data sources, transformations, and reporting logic to maintain consistency and trust over time.
As business needs evolve, we refine dashboards, add data sources, and improve performance to keep reporting relevant.
Designing and deploying interactive dashboards that provide real-time business performance visibility.
Building leadership-level views that summarize revenue, cost, profitability, and strategic KPIs.
Analyzing pipeline performance, campaign results, and customer trends to improve growth strategies.
Tracking operational efficiency, inventory, and process performance to identify optimization opportunities.
Providing structured financial visibility to support budgeting, forecasting, and cost control.
Connecting multiple systems and transforming raw data into structured reporting datasets.
Empowering teams with tools and training to explore data independently within governed frameworks.
Defining performance metrics that align reporting with strategic business objectives.
Improving data consistency, validation, and accountability across reporting environments.
Preparing structured data foundations that can support predictive analytics and AI initiatives.
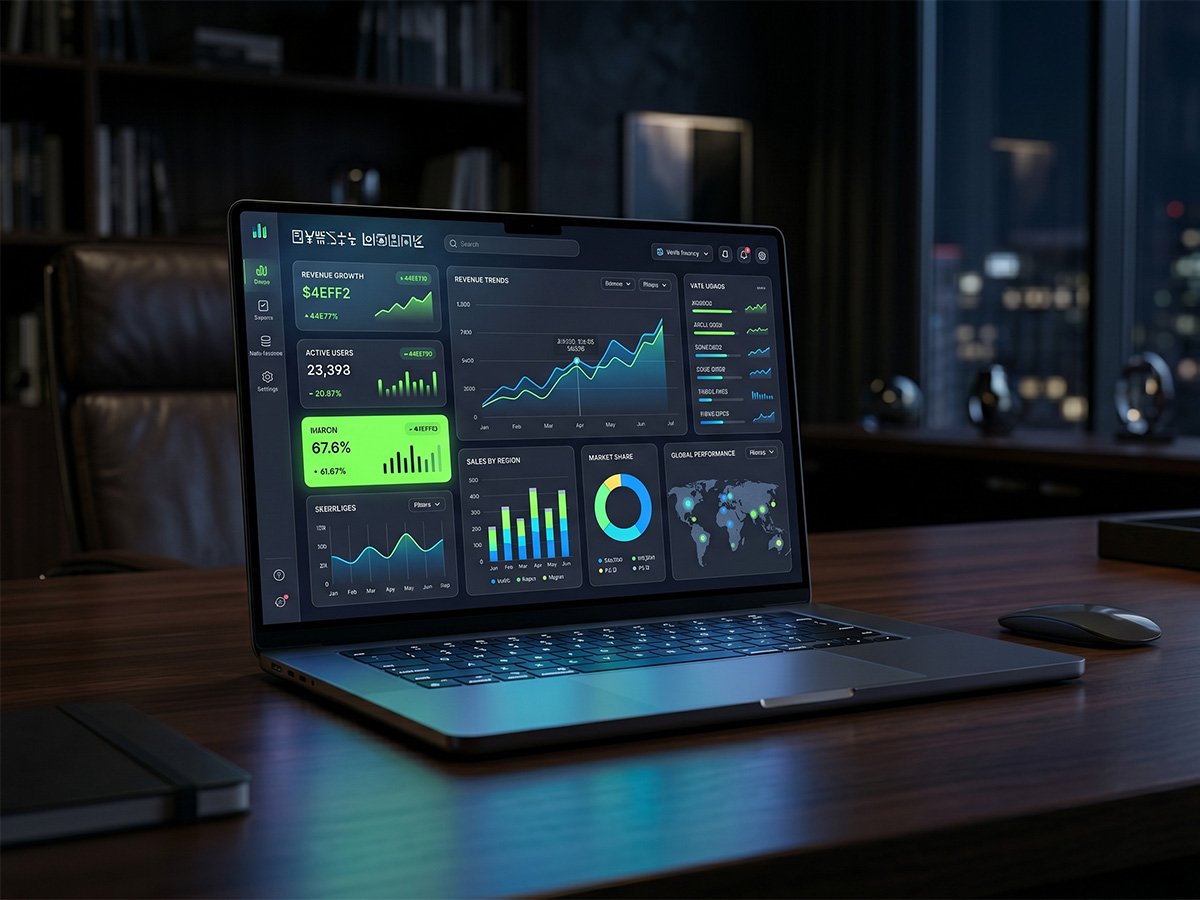
We specialize in Microsoft Power BI and Tableau, delivering interactive dashboards, executive reports, and business intelligence solutions tailored to your reporting and analytics requirements.
Yes. We integrate data from ERP systems, CRM platforms, finance applications, marketing tools, cloud databases, spreadsheets, and other business systems to create a single, unified reporting environment.
We implement structured data validation, transformation rules, reconciliation processes, and governance practices to improve data quality, consistency, and reporting reliability.
Yes. We build executive dashboards focused on strategic KPIs, financial performance, operational metrics, growth trends, and decision-support insights for leadership teams.
Yes. We enable self-service analytics by creating governed data models, intuitive dashboards, and user training so business teams can safely explore data and build their own reports.
Dashboard refresh schedules can be configured based on your business needs, including real-time, near real-time, hourly, daily, or other scheduled refresh intervals depending on your data sources and infrastructure.
Yes. We work with stakeholders to define standardized KPIs, business metrics, calculation logic, and reporting frameworks that align with your strategic objectives.
Absolutely. We design scalable BI architectures that can accommodate additional users, departments, data sources, business units, and reporting requirements as your organization expands.
We provide user training, dashboard walkthroughs, documentation, and best practices so both technical and business users can confidently utilize the BI platform.
Simply schedule an initial consultation with ZS Global. We will assess your reporting needs, existing data landscape, and business objectives before recommending a tailored Business Intelligence implementation roadmap.
Harness the power of structured analytics and business intelligence to drive smarter strategies and measurable growth. ZS Global helps you transform scattered data into clear, trusted insights that support confident decision-making.

ZS Global is an independently owned and operated business. It has no affiliation, association, partnership, sponsorship, endorsement, ownership, control, or other direct or indirect relationship whatsoever with ZS Associates, Inc. or any of its affiliated entities.